


Most traders intuitively understand that returns mean very little without context. What ultimately matters is how those returns are generated, the drawdowns required to earn them, and whether the strategy survives hostile market environments.
That is precisely why equity market neutral (EMN) trading strategies have been a core allocation for institutional capital for decades—and why they are now becoming accessible to sophisticated retail traders.
In this post, we’ll walk through a real institutional dataset, compare it directly to the S&P 500, and then run a simple but powerful thought experiment: what happens if a retail trader applies modest leverage—available today at Interactive Brokers—to an institutional EMN return stream?
The results are eye-opening.
The Institutional Benchmark: Equity Market Neutral Trading Index vs. S&P 500
Let’s start with the raw data.
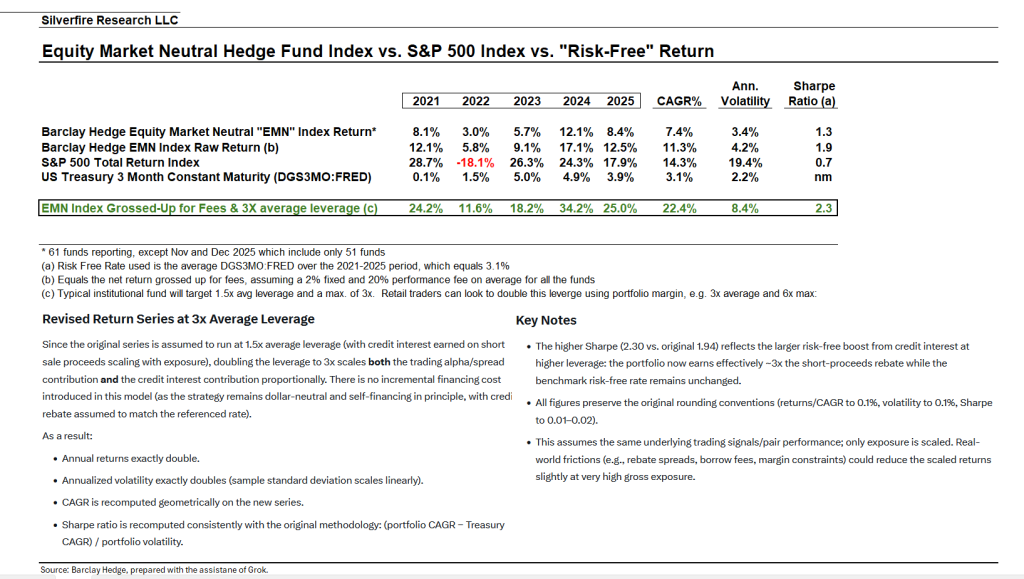
The Barclay Hedge Equity Market Neutral (EMN) Index aggregates results from roughly 60 professional market-neutral hedge funds. These funds typically run long/short equity portfolios with tight factor controls, low net exposure, and disciplined risk management.
From 2021–2025, the raw EMN index (before fees are netted out but without aggressive leverage) produced:
- ~11.3% annualized return (CAGR)
- ~4.2% annualized volatility
- Sharpe ratio ≈ 1.9
- Maximum drawdown ≈ 4%
Now compare that to the S&P 500 Total Return Index over the same period:
- ~14.3% CAGR
- ~19.4% volatility
- Sharpe ratio ≈ 0.7
- Maximum drawdowns multiple times larger
- –18.1% return in 2022
Yes, the S&P slightly outperformed in headline CAGR—but only by assuming equity beta, massive volatility, and stomach-churning drawdowns.
The EMN index delivered comparable returns with roughly one-fifth the volatility.
That is not a small difference. It is a structural one.
2022: The Year That Exposed the Difference
If you want a single year that perfectly illustrates the power of market neutrality, look at 2022.
- S&P 500: –18.1%
- EMN Index (raw): +5.8%
While equity investors endured one of the worst years in decades—rising rates, collapsing multiples, and broad-based losses—market neutral strategies quietly compounded capital.
Why?
Because EMN does not rely on market direction. It monetizes relative mispricings between stocks, not the level of the index.
For traders who care about consistency and capital preservation, this distinction is everything.
A Thought Experiment: What If You Applied 2× Leverage?
Here’s where things get interesting.
Institutions typically run the EMN index at ~1.5× average leverage. Retail traders, however, can access 2× or more leverage today using IBKR Portfolio Margin, while still remaining within conservative risk parameters.
So let’s ask a simple question:
What would the EMN return profile look like at ~2× leverage?
Using the provided analysis (which scales exposure linearly and recomputes CAGR and volatility properly), the results are:
Leveraged EMN Profile (≈2× Exposure)
- ~22% CAGR
- ~8.4% annualized volatility
- Max drawdown ≈ 8–9%
- Sharpe ratio > 2.3
Now compare that to the S&P 500 again:
CAGR: ~22% (2× EMN) vs ~14% (S&P 500)
Volatility: ~8% (2× EMN) vs ~19% (S&P 500)
Max Drawdown: ~8–9% (2× EMN) vs much higher (S&P 500)
2022 Return: strongly positive (2× EMN) vs –18% (S&P 500)
This is the key insight:
With modest retail-accessible leverage, EMN delivers higher returns than the S&P 500 at less than half the risk.
That is an extraordinary payoff asymmetry.
Stability Matters: Only 7 Down Months in 5 Years
Now let’s overlay the monthly return history of the EMN Index (Source: Barclay Hedge Jan, 2026).
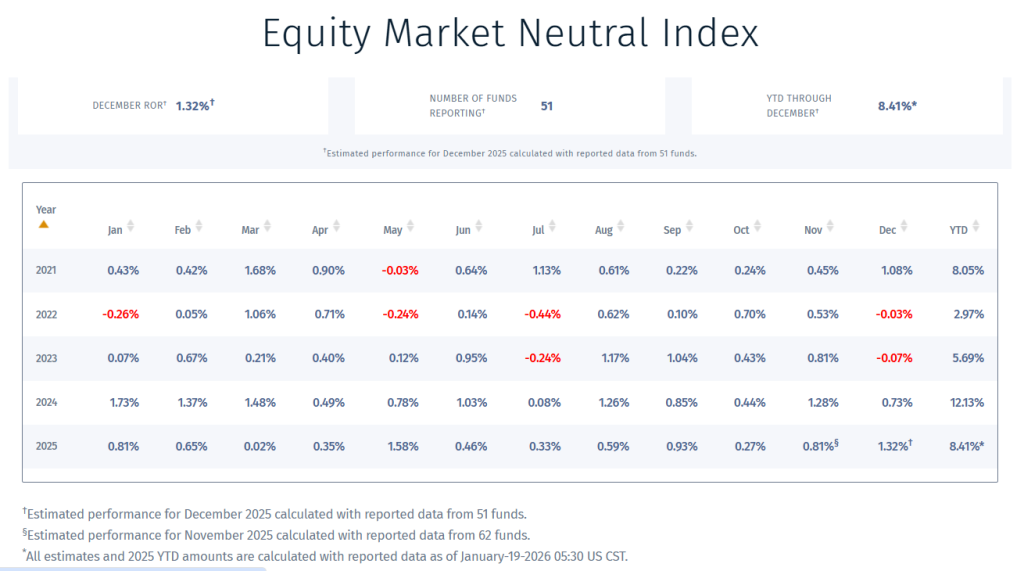
From January 2021 through December 2025 (60 months):
- Only 7 months were negative
- The vast majority of monthly returns clustered between +0.3% and +1.3%
- Losing months were shallow and quickly recovered
- No extended drawdown cycles
This is exactly what you want when applying leverage.
Leverage doesn’t fail because returns are low—it fails because returns are unstable. EMN’s month-to-month consistency is what makes it uniquely suited to scaled exposure.
By contrast, the S&P 500 experiences:
- Long losing streaks
- Volatility clustering
- Deep left-tail events
- Multi-year drawdown recoveries
Leveraging that profile is dangerous. Leveraging EMN is rational.
Why Retail Traders Haven’t Accessed This—Until Now
If EMN is so compelling, why isn’t everyone doing it?
Because implementation is hard.
Institutional EMN funds rely on:
- Systematic pair selection
- Continuous spread monitoring
- Risk-balanced position sizing
- Factor neutrality
- Automated execution
- Tight integration with prime brokers
Historically, retail traders lacked the tools to replicate this professionally.
That gap is exactly what PairTrade Finder was built to close.
PairTrade Finder®: Institutional EMN, Retail Execution
PairTrade Finder® is the platform that enables retail traders to execute true equity market neutral strategies, connected directly to Interactive Brokers.
With PairTrade Finder®, traders get:
- Institutional-grade pair discovery
- Live spread analytics and signal generation
- Risk-aware position sizing
- Semi-automated or fully automated execution
- Portfolio-margin compatibility at IBKR
- A full education suite to get new traders productive fast
In other words, it’s not just a scanner—it’s an EMN operating system.
The Opportunity in Front of You
The data is clear:
- Institutional EMN delivers ~11%+ returns with minimal drawdowns
- Applying retail-available 2× leverage transforms that into ~22% CAGR
- Risk remains dramatically lower than equity beta
- Performance is stable across bull, bear, and sideways markets
- Monthly consistency makes leverage sustainable
This is not a theoretical edge. It is a documented, decades-old institutional strategy—now available to retail traders with the right tools.
If you’ve ever wanted:
- Equity-like returns without equity-like drawdowns
- A strategy that thrives in market stress
- A scalable, rules-based approach to trading
Then equity market neutral trading deserves your attention.
Start Equity Market Neutral Trading Risk-Free
PairTrade Finder® offers a 15-day free trial, with no obligation.
Explore the platform. Review the education. Connect to IBKR. And see for yourself how institutional EMN strategies can finally be executed at the retail level.
Consistency beats hero trades.
Risk-adjusted returns beat narratives.
And market neutrality beats guessing direction.
Welcome to the professional side of trading.
