


Since the start of 2025, the PTF USA Equities Statistical‑Arbitrage* Research Account has been quietly building a disciplined, data‑driven edge in the crowded world of U.S. equities. Leveraging the proprietary PairTrade Finder® Ultimate Alpha 3 engine, the fund monitors ≈ 136 liquid U.S. equity pairs on a real‑time basis, automatically generating and executing trade signals without human discretion. The result is a pure statistical‑arbitrage strategy that isolates relative‑value mispricings, captures mean‑reversion dynamics, and does so with tight risk controls.
Core Pair Selection Methodology & Backtest Filters
Our selection criteria mirror the parameters disclosed on the public PairTrade Finder® autoload page (www.pairtradefinder.com/autoload.html). In practice, each candidate pair must satisfy:
Securities Universe:
- USA-Exchange-Traded (NYSE/NASDAQ/AMEX)
- > $2 bln mkt cap
- > $2 million/day of average daily traded volume($)
- Easy-to-borrow
- Fundamentally Correlated: same national market, same sector, usually same industry sub group. Preference for beta and market-cap-similar pairs
Three-Year Minimum Backtest Results:
- Cointegration (CADF Test): p-value< 0.10
- Correlation (50-day): 50%+
- Maximum PnL Drawdown (%): <15%
- Profit Compound Annual Growth Rate %: > Max DD%
No Trading Signal Filtering Applied, Pure Statistical-Arbitrage!
Pairs that meet these quantitative screens are fed directly into the autotrade engine. Crucially, the system does not filter out corporate actions, earnings releases, dividend announcements, or other fundamental-value shifting events. By exposing the strategy to the full spectrum of market noise, we preserve the statistical-arbitrage purity of the signal. This approach avoids hindsight bias that can creep in when discretionary filters are applied. Our objective? Over time and through the law of large numbers, the positive and negative outliers may cancel themselves out.
Execution & Risk Management
All trades are executed in a synthetic Interactive Brokers paper‑trading account (DU3656439), overseen by Portfolio Manager Geoff S.T. Hossie, CMT. The account traded over the period 1 Jan 2025 – 13 Aug 2025 (the date of closing). The engine generated ≈ 431 closed statistical-arbitrage trades across the monitored pairs. Each position is sized to a maximum 1.5% risk of the account equity. This discipline helps ensure no single trade can materially erode capital. The only stop loss applied is a time stop of 50 days in trade. Pairs that developed high volatility Ratios were excluded over time.
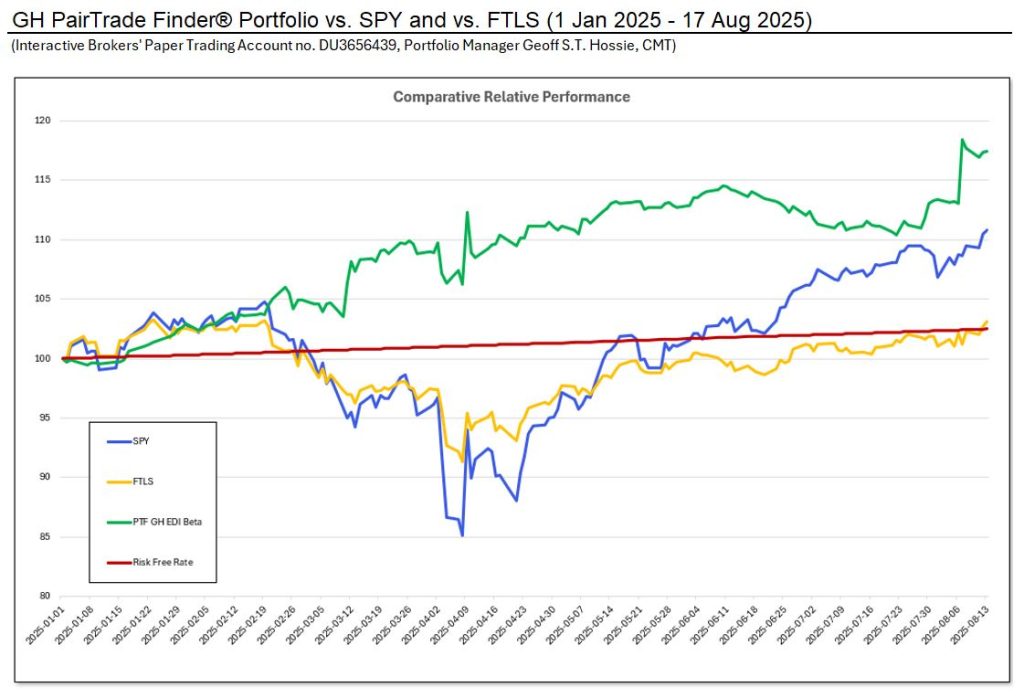
The chart above illustrates the fund’s equity curve alongside two widely followed benchmarks: SPY (S&P 500 ETF) and FTLS (First Trust Long/Short Equity ETF). Despite the absence of fundamental filters, the fund consistently outperformed both benchmarks. The Account delivered a compound annual growth rate (CAGR) of ~ 17 % vs ~ 11% for SPY and ~ 3% for FTLS.
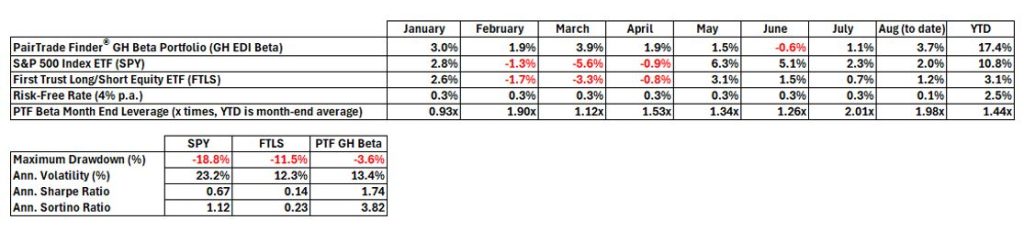
Headline figures of note:
Total Net Return: +17.4%
Average Compound Monthly Return: +2.2%
Maximum Drawdown: -3.6% vs. -18.8% for SPY and -11.5% for FTLS
Sharpe Ratio (Ann.): 1.74
Sortino Ratio (Ann.): 3.82
Average Leverage: 1.4x, with a maximum of 3x
Why Sophisticated Traders Should Pay Attention to Our Statistical-Arbitrage Research Account
- Pure Statistical Edge – By eschewing discretionary filters, the strategy captures the raw, repeatable relationship between cointegrated and correlated equities. This purity translates into a cleaner risk‑return profile that is easier to model and stress‑test.
- Scalable, Private Architecture – The underlying PairTrade Finder® Ultimate Alpha 3 platform sits client-side for privacy and is built on a C#, .Net framework stack capable of backtesting 10s of thousands of pairs and handling hundreds of concurrent pair evaluations real-time. Scaling the approach to additional asset classes (e.g., ETFs, futures) requires only minor parameter adjustments.
- Robust Risk Controls – A hard 1.5% per‑trade risk cap, combined with our time stop, keeps tail‑risk low. The observed maximum drawdown of –3.6 % is well within the comfort zone of high‑net‑worth investors and institutions who demand capital preservation.
- Transparent Attribution – Every trade in this research project is logged with full audit trails: entry/exit timestamps, Ratio stretch calculations, and commissions and execution slippage. This level of granularity satisfies the due‑diligence standards of institutional capital allocators.
- Performance Consistency – The fund’s outperformance persisted across varied market regimes—bullish rallies, sideways consolidation, and the early‑year volatility spike surrounding earnings season. The lack of earnings‑filtering did not degrade returns; instead, the algorithm leveraged the heightened dispersion that such events create.
Looking Forward
The next phase of the PTF USA Equities Statistical‑Arbitrage Research Fund will be to shift to real-money trading. Additionally, we are piloting a multi‑factor overlay that blends momentum, sentiment and individual chart technical metrics without compromising the core mean‑reversion premise.
Are you a sophisticated investor/trader managing a $20 k+ portfolio who seeks a systematic, low‑correlation return stream? PTF Ultimate Alpha 3 used with our proprietary strategic approach offers a compelling proposition: statistical rigor, disciplined risk, and demonstrable outperformance against traditional equity and long/short benchmarks—all delivered through a fully automated, transparent pipeline.
Ready to explore allocation opportunities or receive a private data‑feed of the live pair‑monitoring dashboard? Contact us at gh@theeventdriveninvestor.com to arrange a confidential briefing.
Best regards,
The PairTrade Finder® Team
www.pairtradefinder.com | Award-Winning Pair Trading Software
* Equities Statistical Arbitrage (Stat Arb) is a quantitative trading strategy applied to stocks (equities). It uses statistical and mathematical models to identify temporary mispricings between related securities, with the expectation that prices will revert to their historical relationship.
Here’s a breakdown:
- Equities → Refers to stocks and shares of companies.
- Statistical Arbitrage → Not true “risk-free” arbitrage, but a probabilistic strategy. It relies on data, correlations, and mean-reversion rather than guaranteed price discrepancies.
Key Features:
- Pairs or Baskets of Stocks
Traders often look for stocks that historically move together (e.g., Coke vs. Pepsi). If their relationship diverges abnormally, one is bought and the other sold short. - Mean Reversion
The bet is that the price spread between these stocks will revert to its historical average. - Market Neutral
Positions are structured to hedge overall market risk (e.g., being long one stock and short another reduces exposure to broad market moves). - Automation & Scale
Typically implemented by hedge funds or quants, executing hundreds of trades across many pairs simultaneously using algorithms.
Simple Example:
If Stock A and Stock B usually trade in lockstep, but suddenly Stock A rises while Stock B falls, a Stat Arb trader might:
- Go long Stock B (expecting it to rise).
- Short Stock A (expecting it to fall).
Profit is made if the spread closes.
👉 So in short: Equities Statistical Arbitrage is a systematic, market-neutral trading strategy that exploits short-term pricing inefficiencies between stocks, aiming for consistent risk-adjusted returns rather than directional market bets.
