


Apogee Enterprises Inc (APOG:NASDAQ) vs Masonite International Corporation (DOOR:NYSE)
Resulting Gross Profit of $1,328.68 in 61 calendar days on $10,000/leg. That’s 13.3% on nominal leg value and up to a 40% return on CFD margined equity (max 6:1).
Summary Profiles (Source: Yahoo! Finance, Company websites)

Apogee Enterprises, Inc. designs and develops glass products and services in the United States, Canada, and Brazil. The company operates through four segments: Architectural Glass, Architectural Framing Systems, Architectural Services, and Large-Scale Optical Technologies (LSO). The company’s products and services are primarily used in commercial buildings, such as office towers, hotels, and retail centers; and institutional buildings, including education facilities and dormitories, health care facilities, and government buildings, as well as multi-family residential buildings. Apogee Enterprises, Inc. was founded in 1949 and is headquartered in Minneapolis, Minnesota. It employs approx. 5,500 people.

Masonite International Corporation designs, manufactures, and sells interior and exterior doors for the new construction and repair, renovation, and remodelling sectors of the residential and non-residential building construction markets worldwide. It offers molded panel, flush, stile and rail, routed medium-density fibreboard (MDF), steel, or fiberglass residential doors. Masonite International Corporation was founded in 1925 and is headquartered in Tampa, Florida. It employs approx. 10,000 people worldwide.
| APOG:NASDAQ vs. DOOR:NYSE | |||
| Summary Fundamental Comparison | |||
| (Source: Yahoo! Finance) | |||
| Financial Statements, Performance | |||
|
Income Statement |
APOG | DOOR | |
| Revenue (ttm) | 1.29B | 2.03B | |
| Quarterly Revenue Growth (yoy) | 30.10% | 5.70% | |
| Gross Profit (ttm) | 292.02M | 409.64M | |
| EBITDA | 172.03M | 241.8M | |
| Net Income Avi to Common (ttm) | 80.28M | 152.32M | |
| Quarterly Earnings Growth (yoy) | 4.90% | 365.40% | |
| Balance Sheet | |||
| Total Cash (mrq) | 13.33M | 176.67M | |
| Total Debt (mrq) | 231.28M | 625.66M | |
| Total Debt/Equity (mrq) | 44.59 | 85.02 | |
| Current Ratio (mrq) | 1.79 | 3.25 | |
| Book Value Per Share (mrq) | 18.11 | 25.47 | |
| Profitability | |||
| Profit Margin | 6.24% | 7.46% | |
| Operating Margin (ttm) | 9.40% | 7.88% | |
| Management Effectiveness | |||
| Return on Assets (ttm) | 8.58% | 6.34% | |
| Return on Equity (ttm) | 16.54% | 22.58% | |
| Valuation Measures | APOG | DOOR | |
| Market Cap (intraday) (USD billions) | 1.28 | 1.88 | |
| Enterprise Value (USD billions) | 1.5 | 2.3 | |
| Trailing P/E | 16.2x | 13.0x | |
| Forward P/E | 12.5x | 13.2x | |
| PEG Ratio (5 yr expected) | 1.7 | 0.3 | |
| Price/Sales (ttm) | 0.99x | 0.92x | |
| Price/Book (mrq) | 2.5x | 2.6x | |
| Enterprise Value/Revenue | 1.16x | 1.14x | |
| Enterprise Value/EBITDA | 8.71x | 9.62x | |
Current Three-Year Backtest Using PairTrade Finder PRO Top 30 Settings
(IQFeed datafeed)
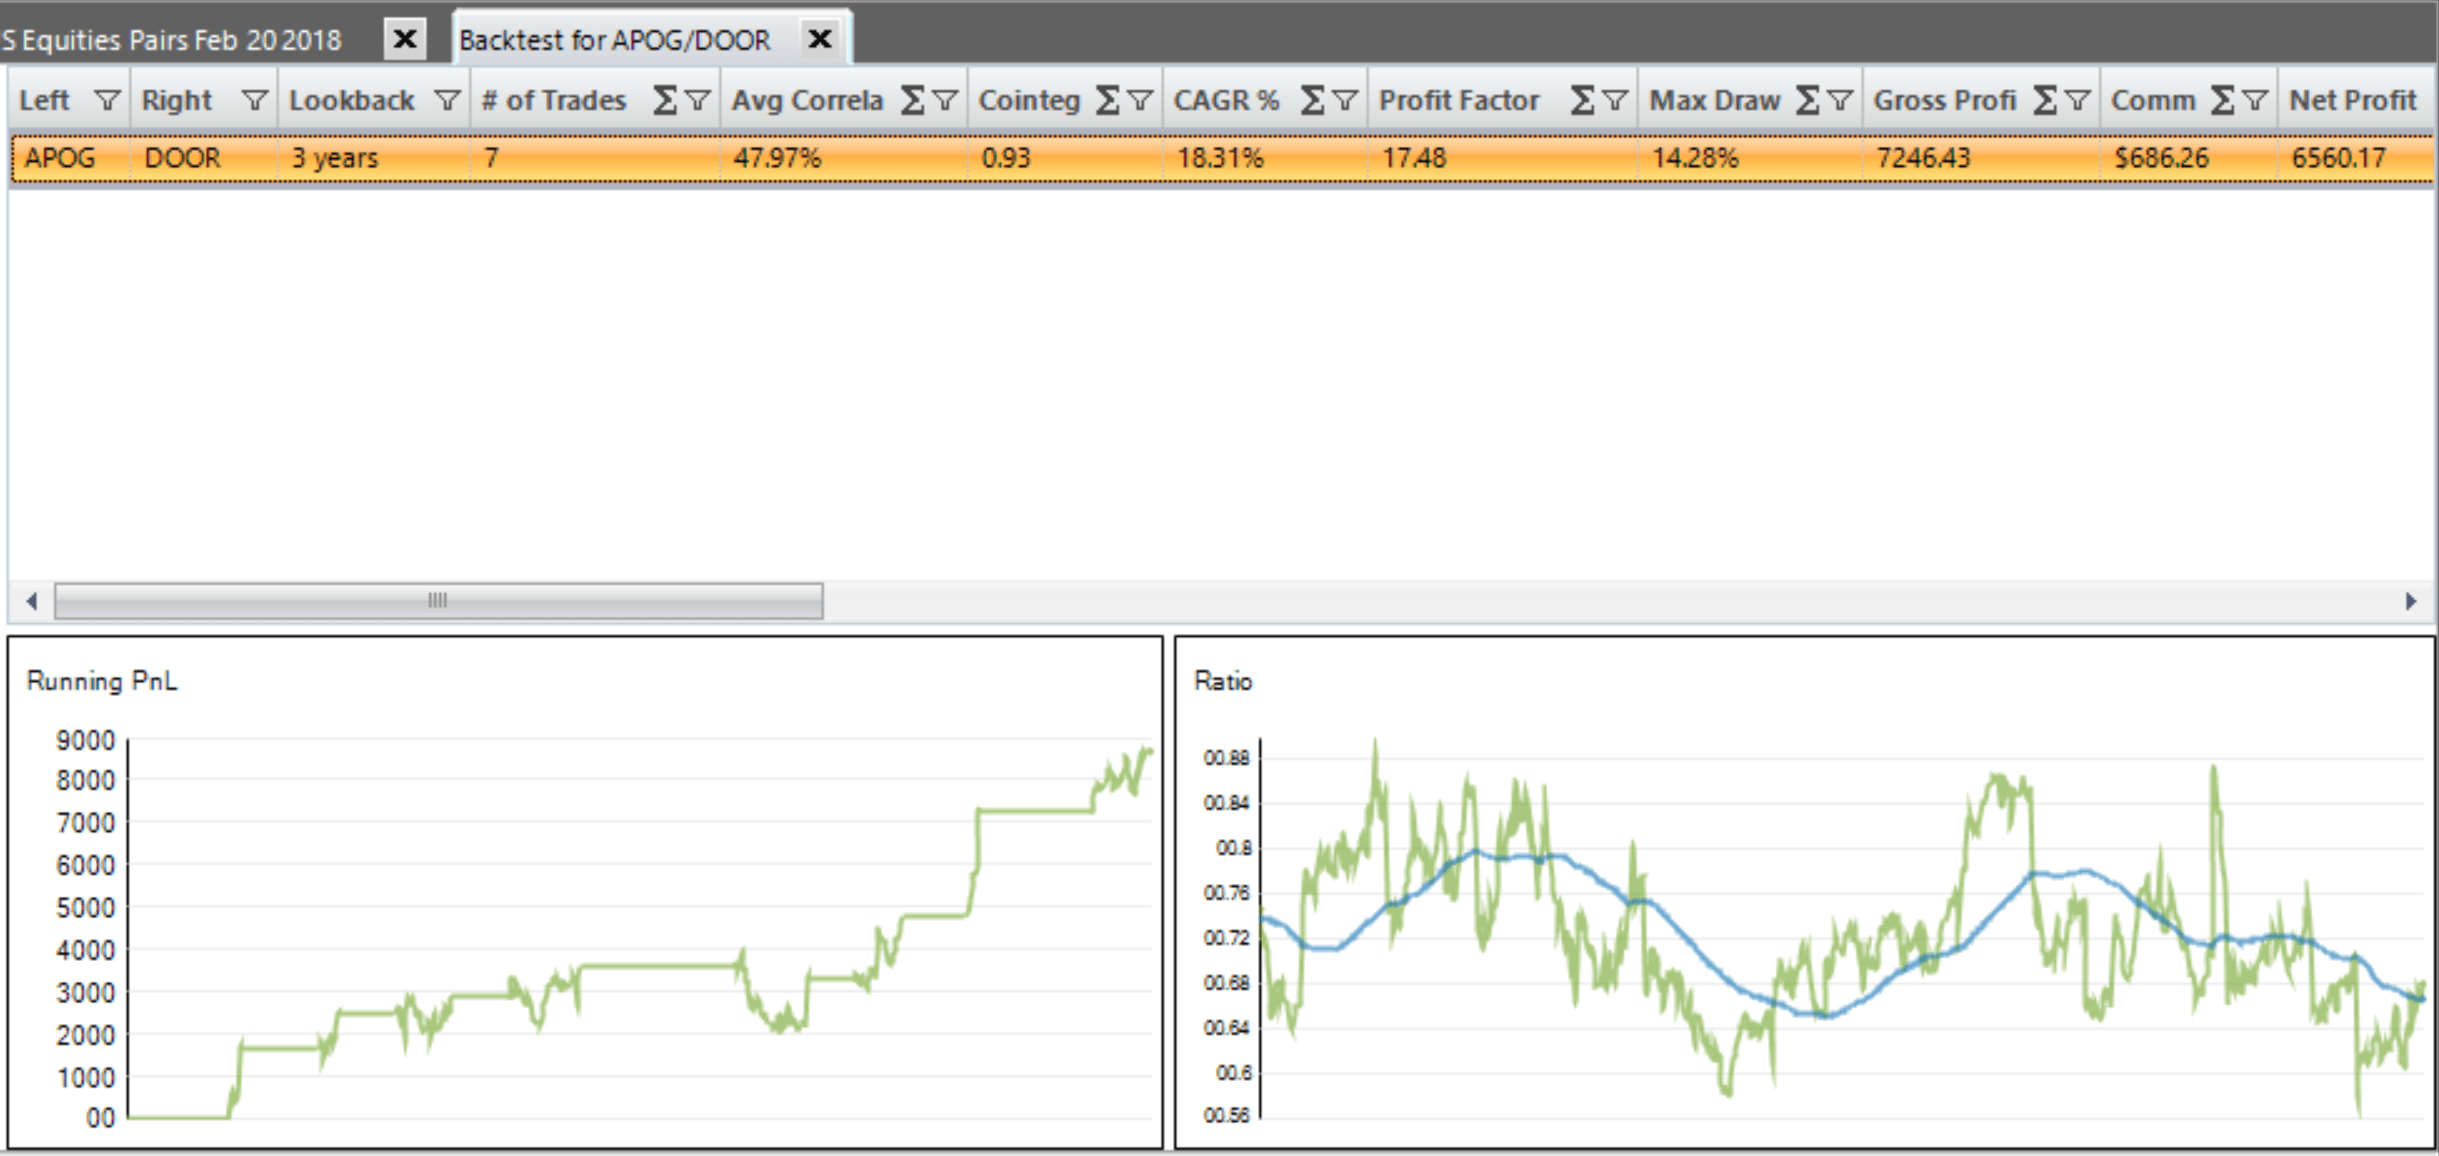
7 trades in 3 years. Avg. Correlation 48%, Cointegration 0.93, CAGR% 18.3%, Max DD% 14.3%, Percent of Winning Trades 86%, Avg. Net Profit per Trade $937. Average Days in Trade 37 days. Great equity curve in the last 12 months. Good ratio line, lots of back and forth, though some periods of trending.
APOG/DOOR Relative Performance Last 12 Months
(IQFeed datafeed)
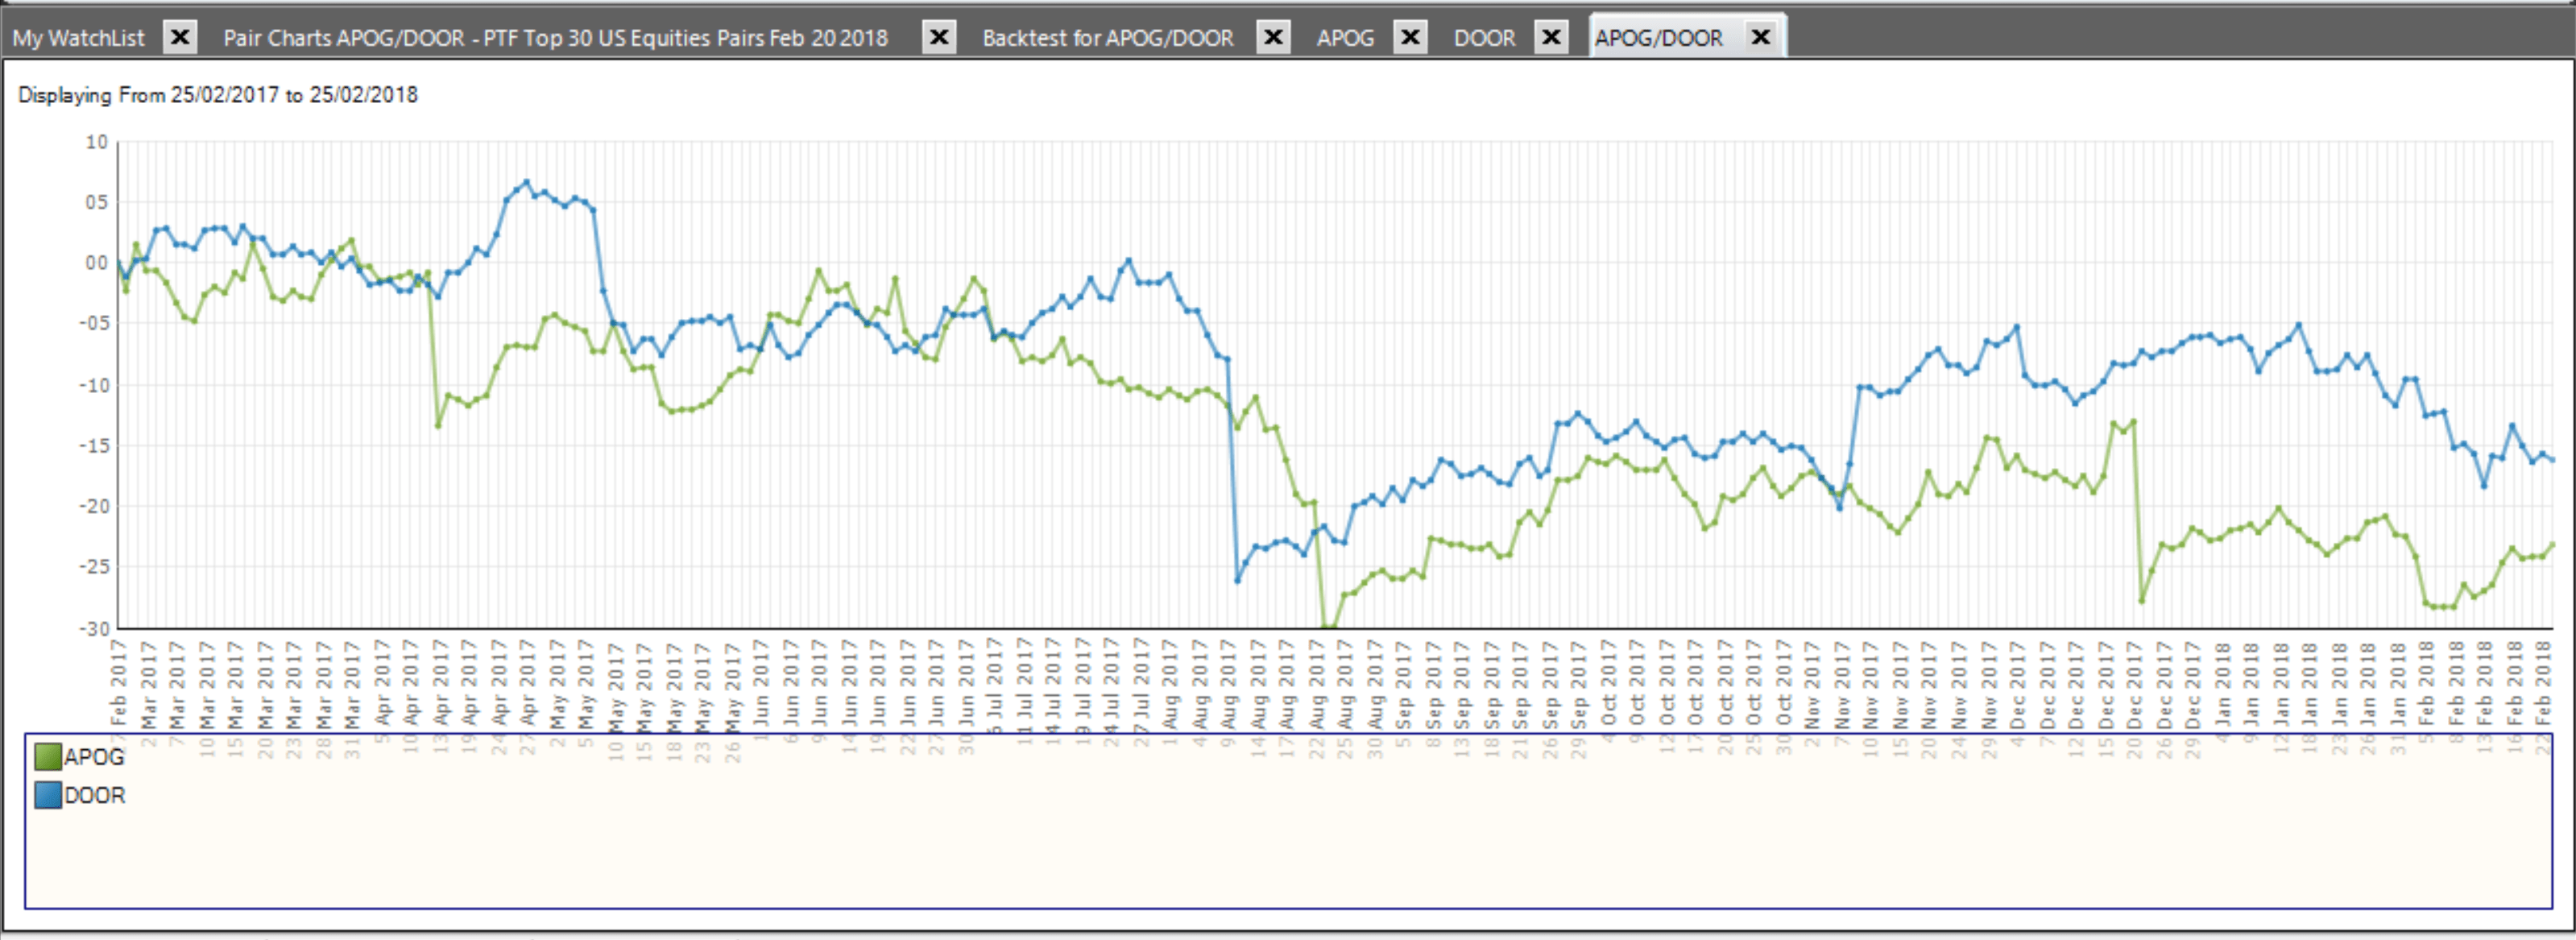
Notice the criss-crossing of the relative performance chart lines over the last year. Shows the cointegration.
Entry Trade Signal EOD 21 December 2017 at -2.95 sd (IQFeed):
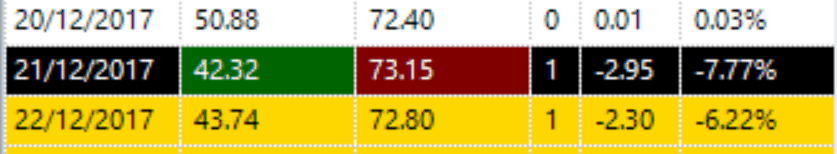
Short Leg: Sell Short 137 shares of DOOR at $73.15 = $10,021.55
Long Leg: Buy Long 235 shares of APOG at $42.32 = $9,945.20
Check News:
APOG – The signal was generated from a performance update press release of APOG on 21 Dec 2017 that announced a restructuring of one of its divisions and a 10-15% negatively revised guidance for the next quarter, on a revenue, EBITDA and EPS basis. HOWEVER, a closer read shows much of the negative revision is due to delayed sales as a result of the Florida hurricanes that hit in Dec 2017, with that sales volume expected to be recovered in the following quarter.
DOOR – No fundamental value affecting news in the 10 days prior to the EOD 21 Dec 2017 Entry Signal.
Check Earnings Announcements & Dividends:
APOG:
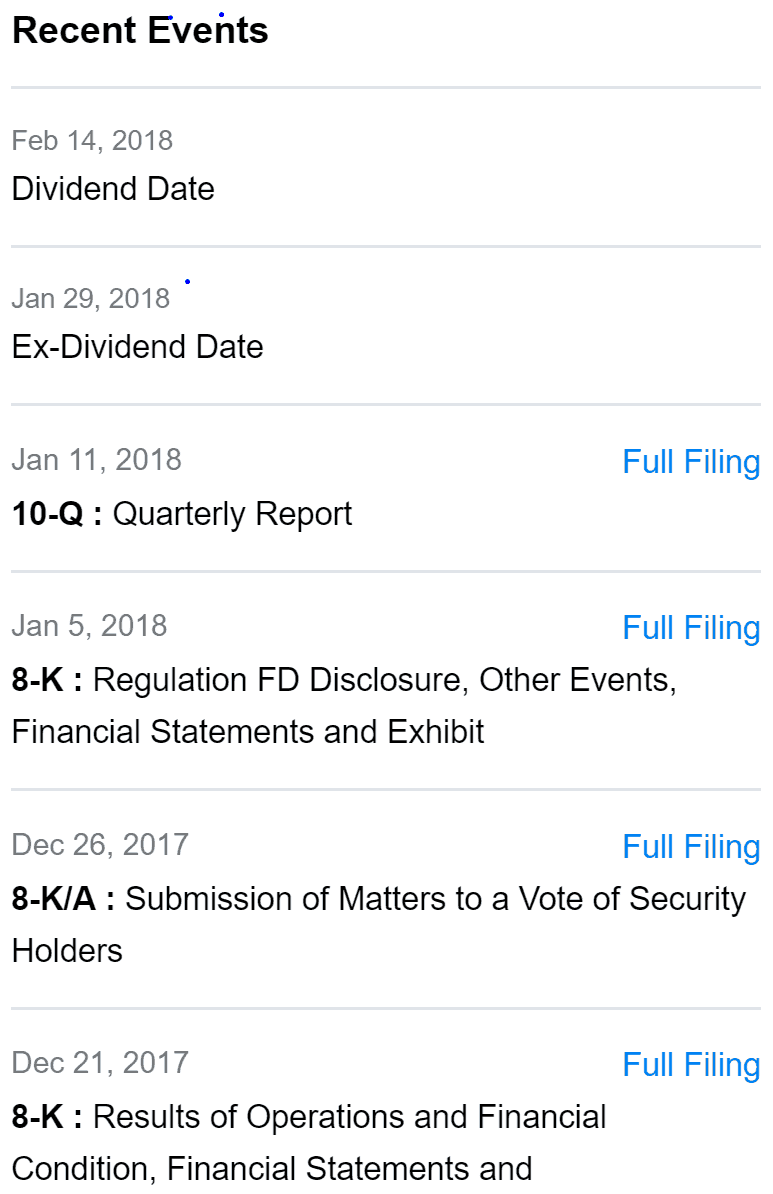
- Results announcement of 21 Dec 2017 was the trigger for the trade signal. Deemed not to have a lasting fundamental value impact on APOG
- 10Q due on 11 Jan 2018 but likely not to have an impact as the results and updated guidance were pre-announced 21 Dec 2017.
- Ex-dividend date of 29 Jan 2018 was over 39 days in the future. With an average trade length of 37 days, this is a bit close but not critical
- Summary: May be deemed clear to trade.
Check Earnings Announcements & Dividends (cont.):
DOOR:
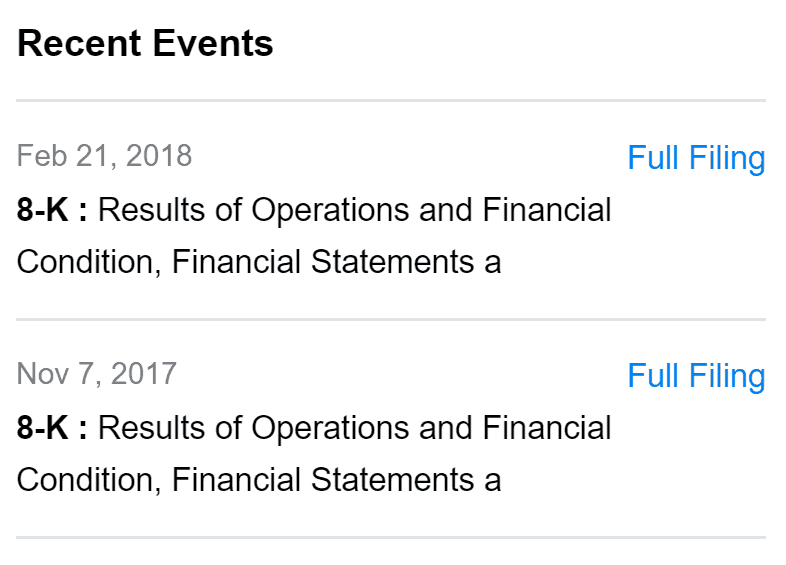
- Results announcement for DOOR was on 7 Nov 2017 and no further announcement was due until 21 Feb 2018, 60 days in the future.
- DOOR does not pay dividends.
- Summary: May be deemed clear to trade.
Pair Charts Covering Trade Period (IQFeed):
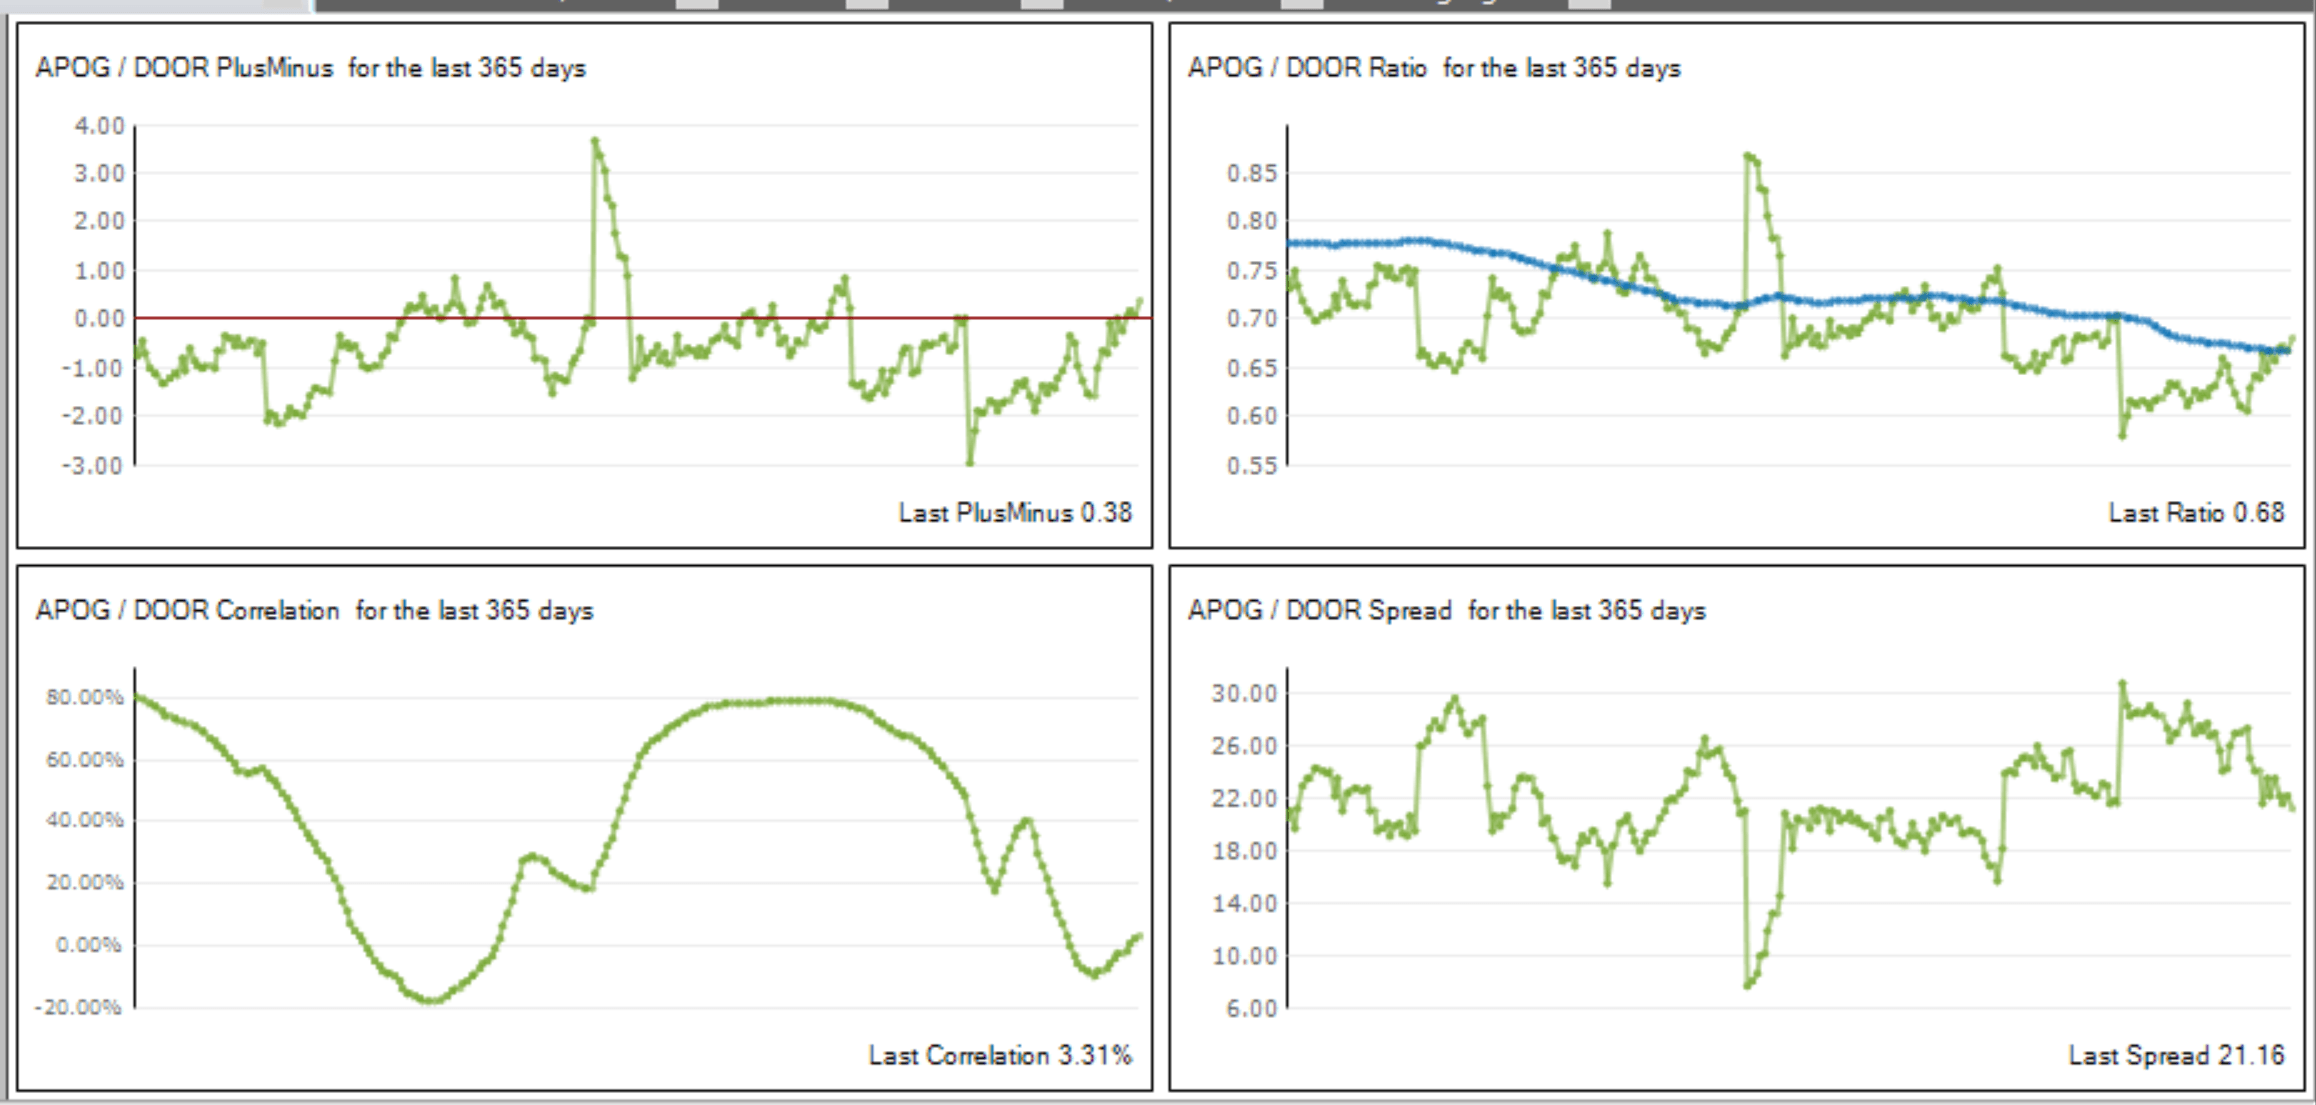
Ratio is in a breakout at time of Entry Signal (a negative), hitting a yearly min and an extension of a gentle downtrend this year (trending ratio is a negative signal). HOWEVER, spread chart shows that the signal is a an annual high and is at RESISTANCE, without breaking it (a positive). Also, despite the gentle downtrend, the pair has offered positive return trades this year with the given ENTRY and EXIT stretch parameters (positive) and has been both above and below the trendline. Strong correlation for the 90 days prior to the signal (positive). RSI of Ratio at time of trade call was at 29, an extreme (a positive).Finally, the EOD signal at -2.97sd shows the market has really “knee-jerked” on the APOG announcement, potentially offering a good fading opportunity.
Conclusion: setup could be better, but on balance the trade ranks as a possible entry.
Recent Volatility for Position Sizing Purposes:
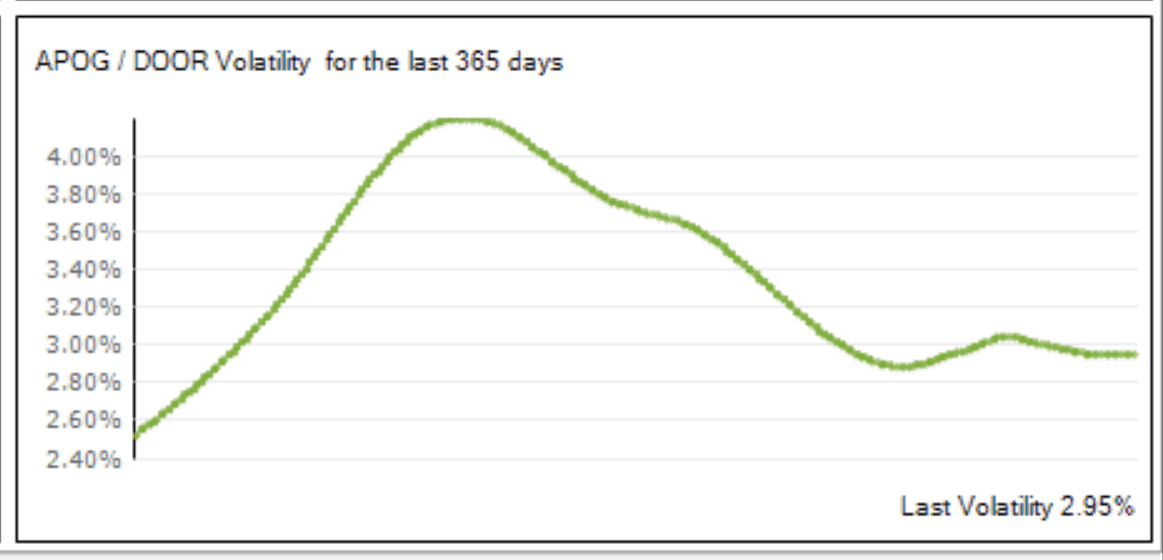
We would rate APOG/DOOR high volatility over last 12 months (range 2.6%-4.2%) and decreasing to 2.95%. Suggests caution on position size, potentially only 50% or 75% of standard leg size.
RESULT OF TRADE
Exit Trade Signal after crossing 0.0 sd:
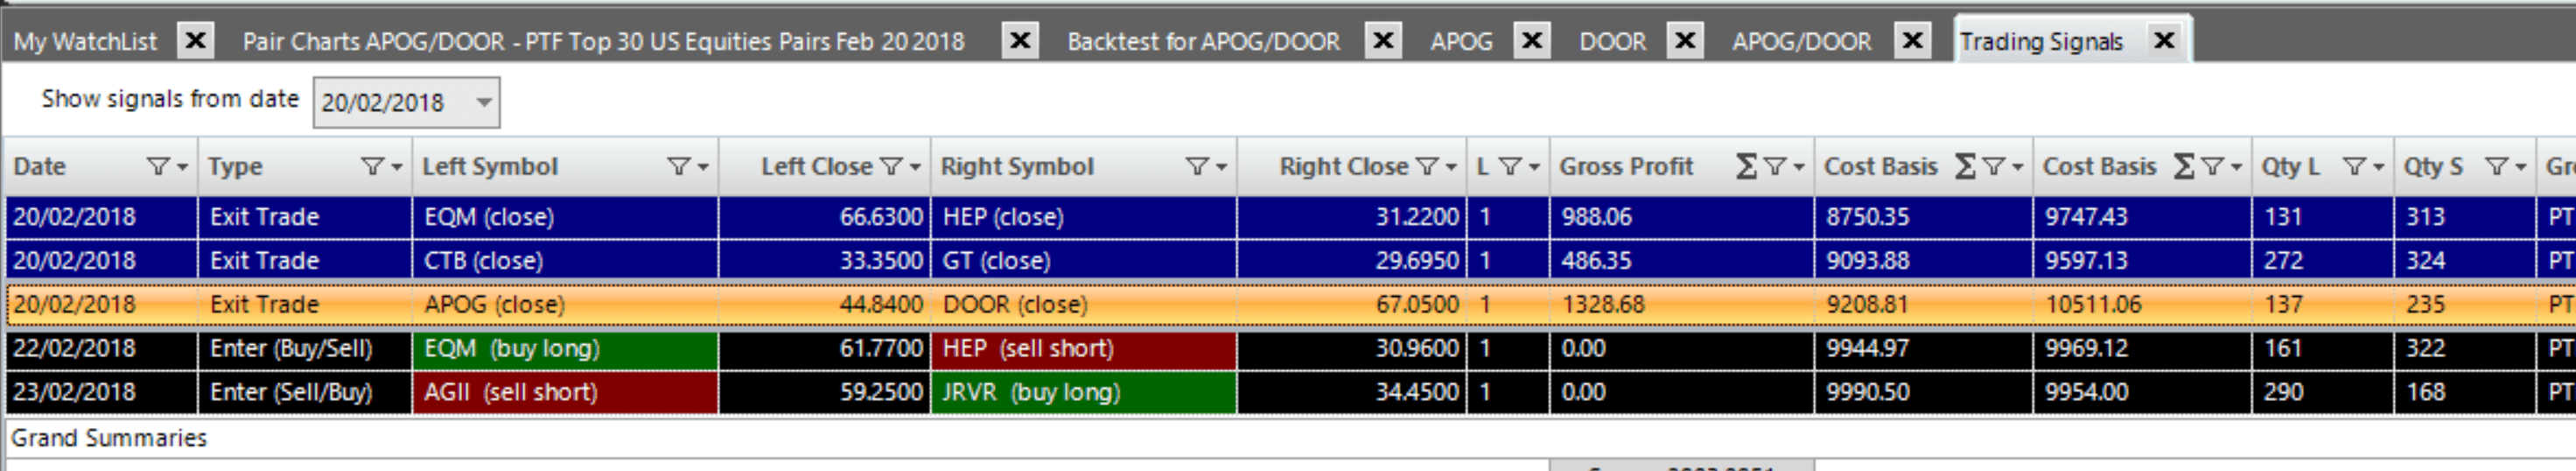
Short Leg: Buy to Close 137 shares of DOOR at $67.05, Gross Result = $835.70
Long Leg: Sell to Close 235 shares of APOG at $44.84, Gross Result = $592.20
Gross Result: $1,427.90, less commissions and slippage estimate and rounding errors of ($99.22) = $1,328.68.
Resulting Gross Profit of $1,328.68 in 61 calendar days on $10,000/leg. That’s 13.3% on nominal leg value and up to a 40% return on CFD margined equity (max 6:1).
NB: The Top 30 example equities pairs in PairTrade Finder PRO are provided for informational and educational purposes only and should not be construed as personalized investment advice. It should not be assumed that trading using the parameters demonstrated by the Software will be profitable and will not result in losses. Please see our full Terms & Disclaimer?here.
![]()
