


Tip # 3 – Analyze Your RSI Chart
Technical analyst J. Welles Wilder created the Relative Strength Index (RSI) as a tool to measure the strength or weakness of the closing price series of a security over time. It is a measure of both velocity (speed!) and magnitude (distance travelled) of price changes and can identify stocks that are either overbought or oversold.
The Relative Strength Index is calculated as RSI = 100 – 100/(1+RS). RS (Relative Strength) is usually calculated as the exponential moving average of daily gains/exponential moving average of daily losses during a defined time period. The standard time frame is 14 days. If losses over that time frame are close to 0, then RS approaches infinity, and the RSI approaches a 100 reading (moonshot!).
If you don’t follow the maths, don’t worry. What you need to know is that when the RSI is exceeding 70 or below 30, then the security in question is entering “overbought” or “oversold” conditions, meaning the price has moved very fast and covered a lot of ground in a certain direction, and may be due a breather. Hence, the RSI is a momentum indicator (oscillator) that we use to help us identify turning points in price action.
For the purposes of pair trading, we look at the RSI of the Price Ratio of security A/security B as opposed to the price action of an individual security. It is a closing price series over time and hence the RSI can be applied.
Pay Attention to the Foot on the Gas Pedal:

Analyze your RSI charts to determine if the Price Ratio of your pair is in the traditional ranges of overbought (RSI is over 70) or oversold (RSI is under 30.) If so, there is generally an increased likelihood of a possible reversal in trend (i.e. reversion to mean – what we are looking for!).
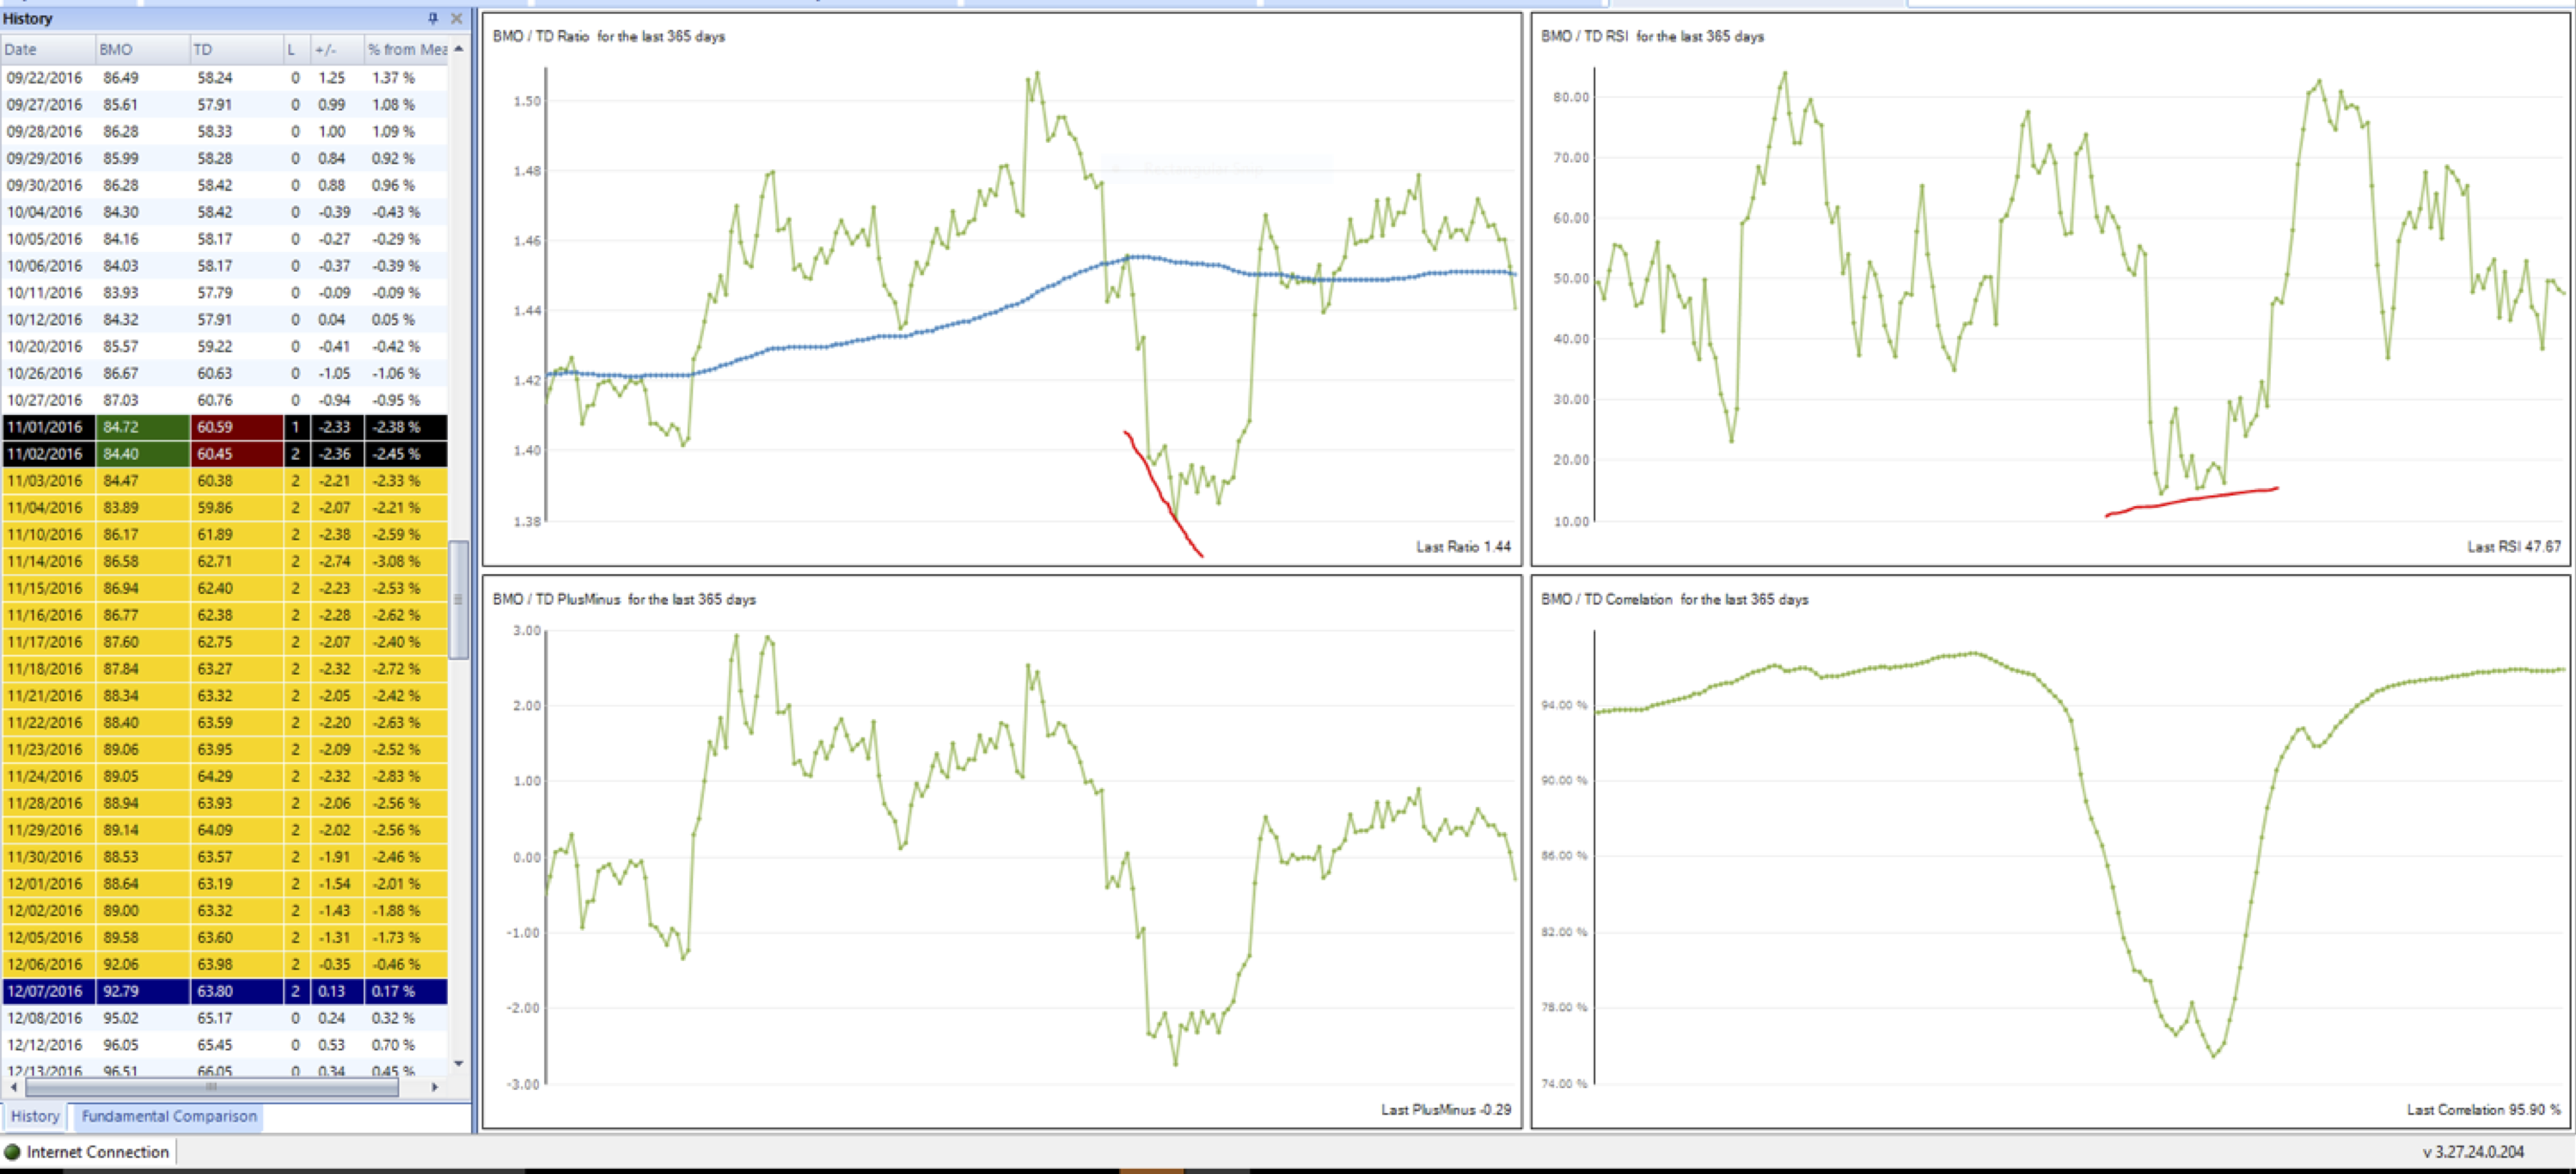
Below is a chart from Pairtrade Finder v3.27 that shows both the Price Ratio chart (upper left corner) and the RSI Chart of the Price Ratio (upper right corner) for the two Canadian banks, Bank of Montreal (TSX:BMO) and Toronto Dominion (TSX:TD). Study and analyse how the RSI extreme readings (>70 and <30) interact with the direction and momentum of the price ratio. When the RSI is heavily overbought or oversold, and the +/- chart in the lower left corner is also > +/-2sd, then a higher probability trade may be setting up. However…
…if you use momentum indicators like RSI you will realise their inherent limitation. When the security in question (in this case the price ratio of two securities) is TRENDING strongly, then the RSI can stay at an extreme level for a long while i.e. the speedometer shows we are going really fast and travelling a long distance, but it doesn’t say we are going to stop now and turn around.
How can we solve this issue? Look for what is called “divergence” between the price action of the Price Ratio and the value of the RSI indicator. In the BMO/TD chart below, look at the red lines that I have drawn on both the Price Ratio chart and the RSI chart. In this still image the dates don’t show up (these appear when you hover your cursor over the relevant datapoint in the Pair Chart in Pairtrade Finder), but the red lines cover the same date range.
What is clear is that the BMO/TD Price Ratio is still declining rapidly, yet the RSI is starting to increase. This situation is shown by a downward sloping red line on the Price Ratio chart vs. an upward sloping red line on the RSI chart. This situation is called divergence, and often signals an imminent turnaround in the price action. Coupled with the extreme reading on the RSI (<20) and the >-2.5sd on the +/- chart, chances are this setup is a good trade to take based on technical analysis (still need to review news and fundamentals).
As the charts show, a profitable trade did indeed result in this instance.
Click to view full version
In our upcoming product Pairtrade Finder PRO, the RSI of the Price Ratio can be used as a backtesting filter and going-forward filter for only choosing trade signals that occur when the Price Ratio RSI is overbought or oversold (and thus potentially more likely to reverse in the short term).
Accurate RSI calculations for screening and backtesting a universe of securities pairs require access to and rapid mathematical manipulation of an enormous amount of data. Contact us to start your 30-day free trial of Pairtrade Finder software, the perfect software tool designed to help you easily and quickly find high probability securities pairs to trade.
Wishing you consistent profitability,
Geoffrey Hossie
Pairtrade Finder
