


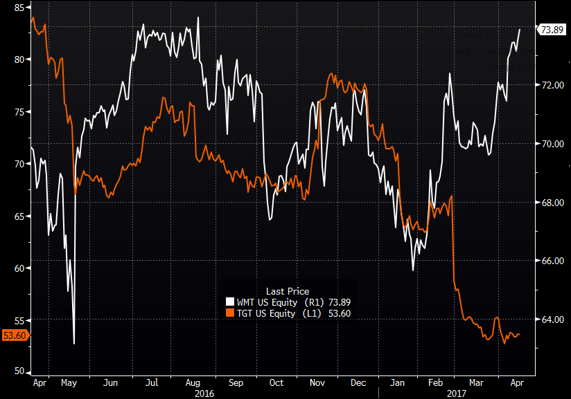
Upon further consideration, this would be a dangerous trade to take. First the y-axes are not synchonised and the prices have not been re-based to zero.
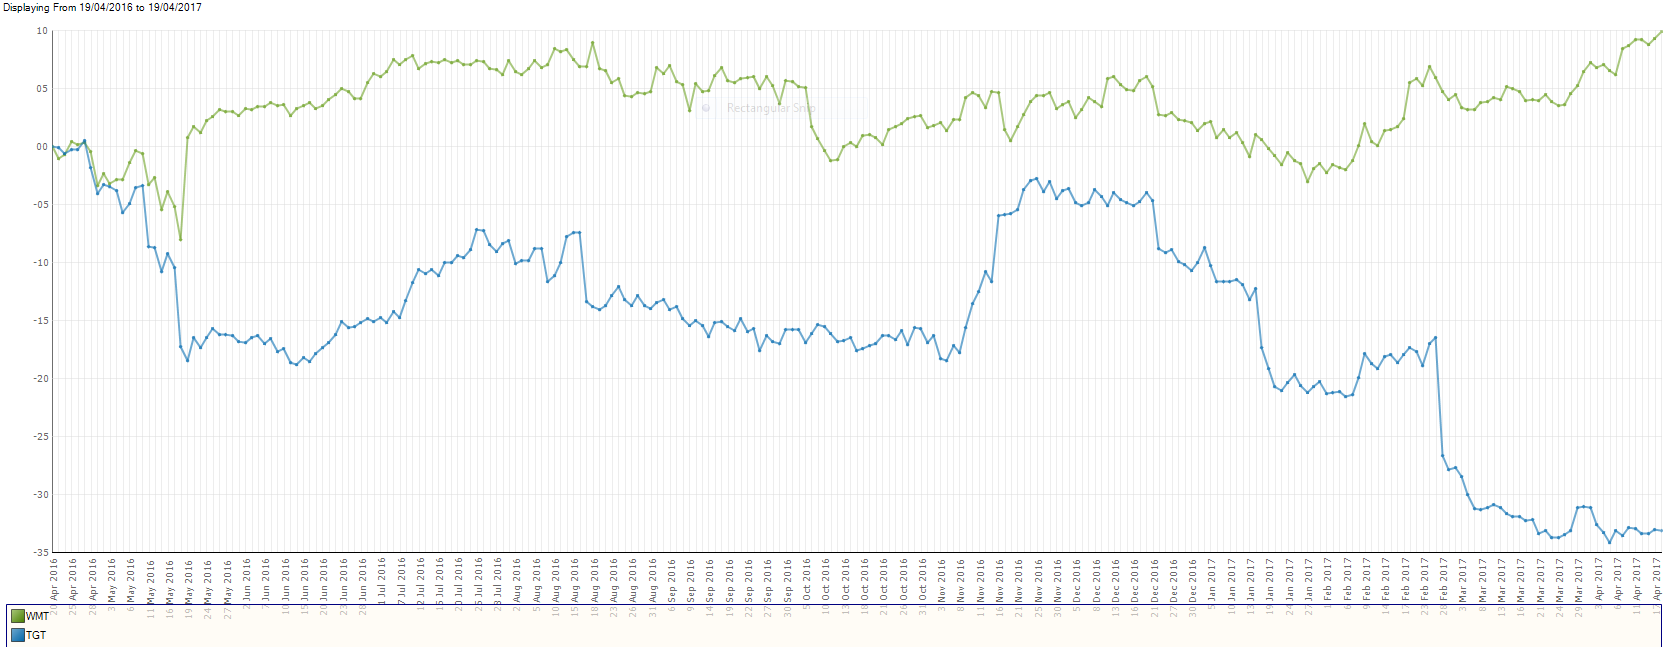
If one rebases the prices to zero (see below), then one can see that over the past year there is little correlation between the two pairs and that the divergence does not necessarily indicate any potential reversion to the mean. The divergence in prices could be based purely on fundamentals.
Source: www.pairtradefinder.com
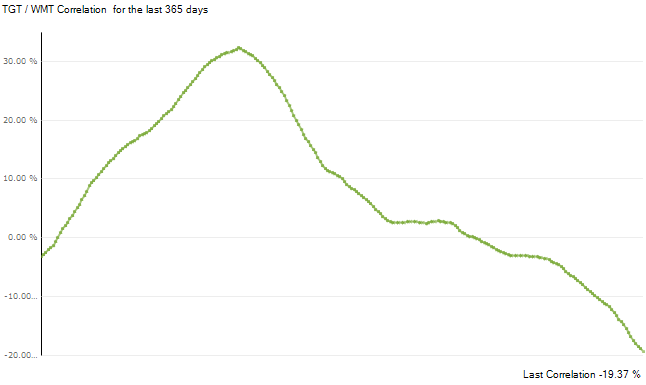
Second, one should check the actual correlation of the two pairs. The chart below shows the declining correlation over the past year between Walmart and Target, which is now a negative correlation. The correlation is now down to about -19%.
Source: www.pairtradefinder.com
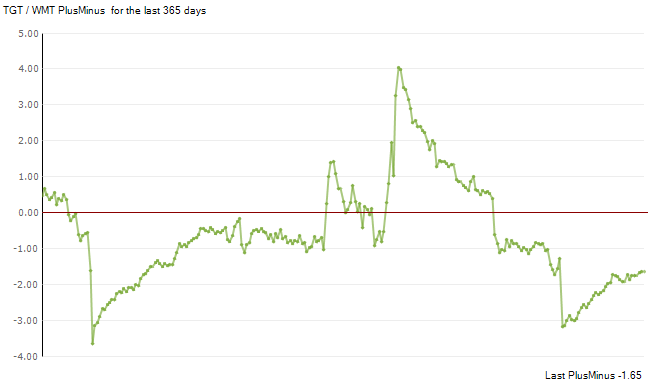
Third, if one backtests the performance of the two shares over the past year (see below), then it is clear from the plus minus chart that there would have been two profitable trades over the past 12 months (using an entry stretch of 2.0 and exit stretch of 0.0).
Source: www.pairtradefinder.com
Assuming a trade sixe of $10,000 per leg and commissions of 0.20%, one would have expected a net profit of approximately $950.
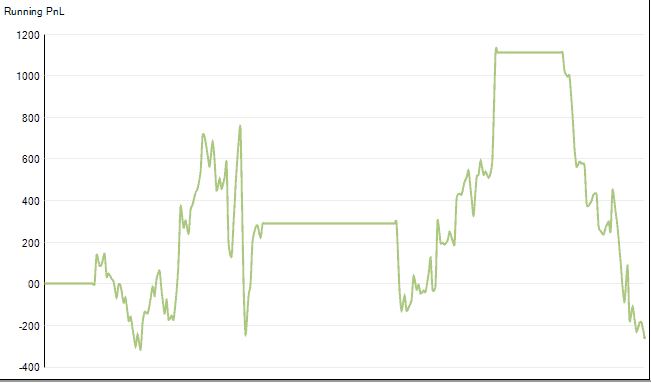
However, the volailtity of the pairs has been very high. As one can see from the chart below, while the cumulative profit from the two pairs at one point during the year would have hit approximately $1,100, it was also running at a loss of nearly -$300 for part of the year. Indeed, the trade is currently running at a cumualtive loss of of -$200.
Source: www.pairtradefinder.com
The lesson? Don’t just look at one chart or listen to a journalist’s view and assume a trade should be a good trade. Do your homework first. It doesn’t have to take long. You can do a backtest and news analysis in about 10 minutes or less. For the sake of your profits, take your time and do it right.
Contact us to start your 30-day free trial of Pairtrade Finder software, the perfect software tool designed to help you easily and quickly find high probability securities pairs to trade.
![]()
