


Here at PairTrade Finder® we receive constant requests from customers and potential customers to demonstrate the actual pair trading profitability of US stocks using the PairTrade Finder® PRO system. Is it profitable and, if so, how profitable? Can it be used as a new career? Can it have a significant impact on the lives of its practitioners?
Pair Trading Profitability Track Record
We don’t publish a real money track record. Nor do we make any promises about your potential returns from pair trading.
However, we are able to show you out-of-sample results for our Top 30 US Equities Pairs released on 12 Nov 2019 until 15 February 2020 as an actual recent example. (We update these Top 30 every 3 months or so. Watch for a new update and promotion in early March!).
We don’t publish the real-money trading results for a simple reason. There is a subjective filtering component of our pair trading system. Accordingly, every trader will trade the raw signals from PairTrade Finder® PRO differently.
The results below are based on the raw signals, with a few filtered out that were based on obvious corporate actions that impacted fundamental value. Here are the Exit Signals in the period: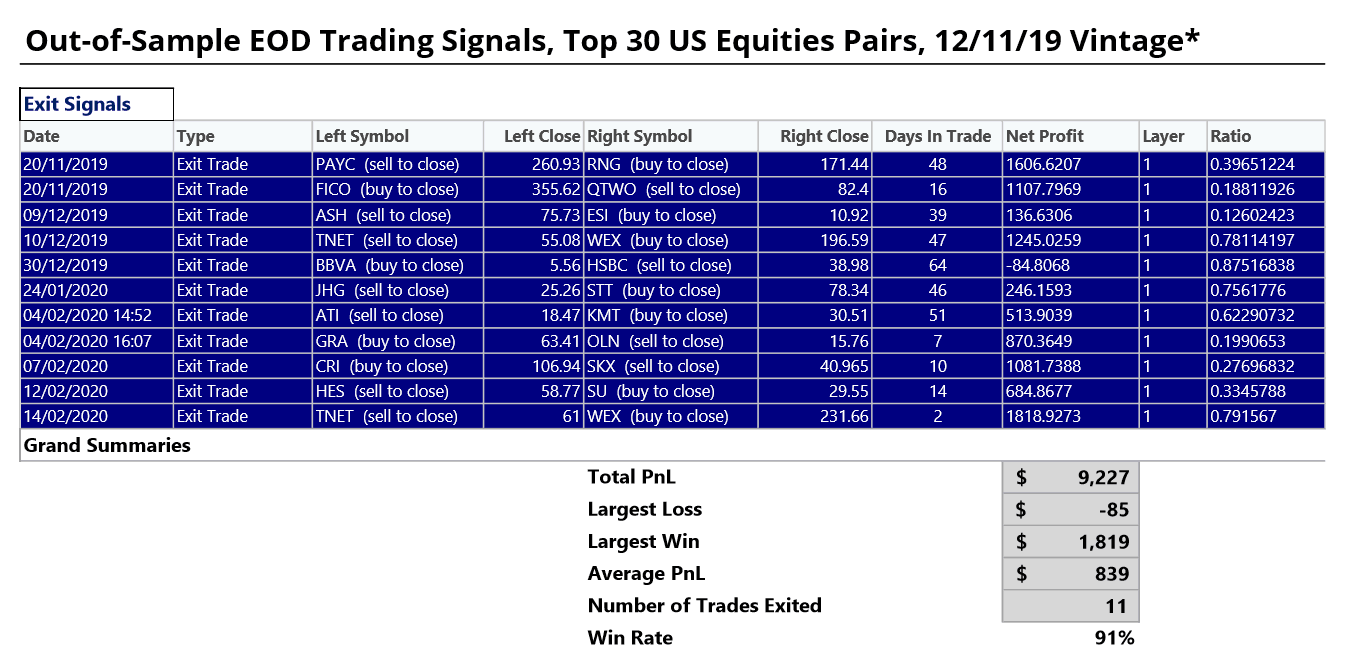 11 trades, 10 winners, $9,227 of profit with a 91% win rate. This vintage of the Top 30 is tracking in excess of our historical backtested results when we created them. A great performance.
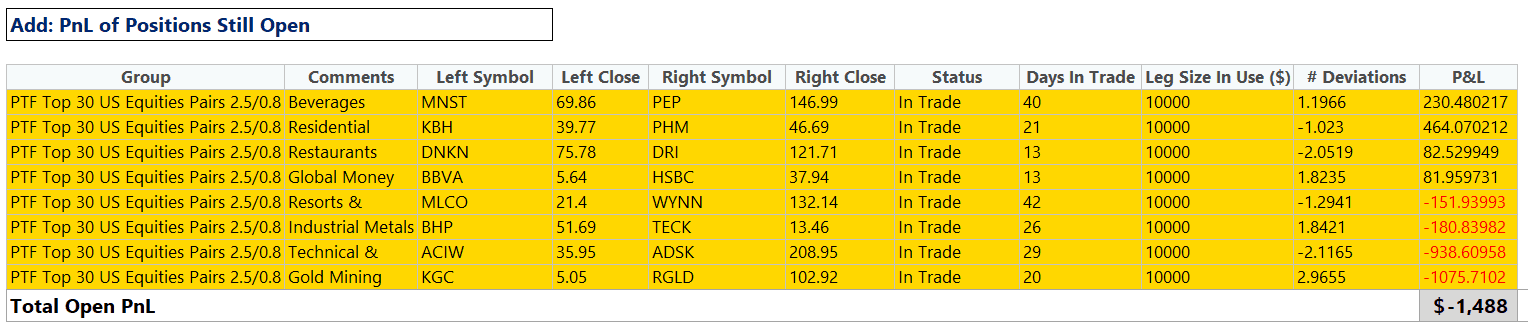
To understand the real mark-to-market performance of the Top 30, we also need to include the PnL value of the open positions. As of the Close on 14 Feb 2020, these are:
Giving a final net result as follows for the three months of trading (12 Nov 2019 to 14 Feb 2020):
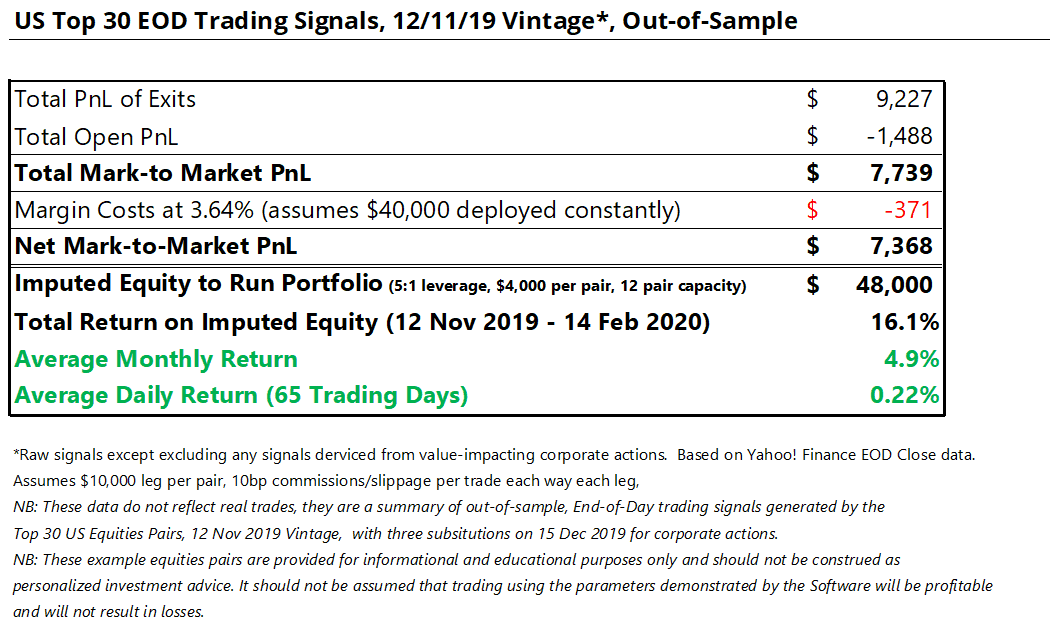 $7,368 Net Profit in three months on about $48,000 of account equity, or 16.1%! We can see that the out-of-sample results from this vintage of our Top 30 US Equities Pairs appears to be delivering.
Are We Meeting Expectations?
The pair trading profitability results expressed in numerous academic studies over the last 10 years (see here: https://blog.pairtradefinder.com/pair-trading-research-studies-articles/) generally show 1% or so monthly alpha. By that we mean 1% per month over the market return, based on 2:1 leverage. So with the effective 4:1 leverage imputed above, empirical pair trading profitability would suggest about 2% per month above the market return.
For comparison, the S&P 500 return over the last 3 months was 9.5% (Yahoo! Finance Adjusted Close data, including dividends). The S&P 500 monthly return was 3.1% over the period.
The Top 30 posted a Net Return of 4.9% per month. Accordingly, they generated approximately 1.8% monthly alpha or 6.6% alpha over the 3-month period, in line with expectations. That equated to a 16.1% total return over these last three months.
What Can Pair Trading Profitability Mean to Me?
According to Investopedia, the average annual return of the S&P 500 from 1957 through 2018 is roughly 8% (7.96%).
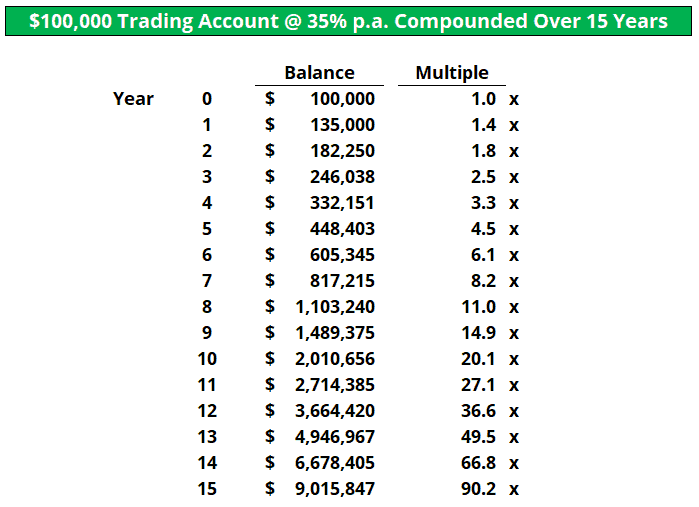
If your pair trading delivers 2% per month alpha, that equals an additional 26.8% p.a. to add to the market return, or about 35% p.a., on 4:1 leverage. Mathematically, here is what happens to a $100,000 account on 35% p.a. over 15 years, all gains reinvested:
Food for thought. As one of the greatest minds of the 20th century has said:

Start learning to pair trade stocks long/short today. Join our 30-minute webinar, free trial, 3-Hour Video Course, eBook and Top 30 US Equities Pairs today. Sign up on the sidebar or at www.pairtradefinder.com.
Happy Trading!
