Lam Research Corporation (NASDAQ:LRCX) vs. Qorvo, Inc. (NASDAQ:QRVO)
***How to Avoid Bad Pair Trades*** Watch pair trader Pedro Alonso take you through our January 2022 Trade of the Month – this time we highlight a Top 30 trading signal NOT TO TRADE and why…so welcome to the first DOG OF THE MONTH for January 2022, LRCX vs. QRVO. It is just as important to learn how to AVOID bad pair trades:
If you watched our Trade of the Month video for Dec 2021, you will have seen in detail how Pedro takes you through our pair trade screening “cheat sheet” to find the best pair trading signals to trade. In this month’s video, Pedro looks in detail at the November Vintage Top 30 U.S. Equity Pair Lam Research vs. Qorvo’s trading signal back in Dec 2021 that ended up as a big losing trade. He shows you the warning signs and the cheat sheet that allow you to avoid trades that are the result of fundamental-value-shifting news releases.
While our Top 30 and FAST 50 are designed to provide you with high-probability stock pair trading signals to study, our video above reiterates and reinforces that you must STUDY these signals and learn how to avoid bad pair trades by knowing how to reject signals that don’t meet our requirements.
PairTrade Finder®’s FAST 50 U.S. Equities Pairs & High-Probability Pair Trading Signals for Review
We do the heavy lifting for you – look for the release this coming week of our latest February 2022 Vintage of our FAST 50 U.S. Equities Pairs!
We analysed over 2,200 U.S. equities to find you some of the best stock pairs to trade! We update this analysis on a quarterly basis to ensure these pairs stay fresh and their correlations and cointegrations strong to offer you the highest-probability setups. The new FAST 50 must meet strict profitability and robustness measures as follows:
- USA Exchange-traded (NYSE/NASDAQ/AMEX): > than $2 bln mkt cap, > $2 million/day of average daily traded volume($), easy-to-borrow
- Similar fundamentals: same national market, same sector, usually same industry sub group. Preference for beta-similar, market-cap-similar pairs
- Backtested with a +/-2.7 standard deviation Entry Stretch, +/-1.0 standard deviation Exit Stretch on the Core Ratio of the pair’s share prices
- Two-year backtest period, Stretch & Ratio Moving Average set to 60-day lookbacks
- COINTEGRATION: We use the Augmented Dicky Fuller test for co-integration and we generally select only pairs with a p-value of 0.10 or less over the 2-year period (see Wild Cards below)
- AVG. CORRELATION: of minimum of approx. 50%, preferably higher over the two-year period. Lower correlation can be tolerated if pair is strongly cointegrated and scores highly on all other criteria, or for our WILD CARD pairs
- Minimum Average Profit per Trade of $200, preferably $250+ (based on $5,000/leg)
- Compound Annual Growth Rate of Net Profits for each pair preferably in excess of Maximum Drawdown % i.e. positive reward/risk
- Maximum historic drawdown < 20%, preferably <15% (before leverage)
- Win Rate at least 70%, usually 80% plus
- Maximum Days in Trade of 50 days. This setting represents our time stop. Average days per trade is around 12-15 days
- WILD CARD PAIRS ADDED: we’ve added some pairs that don’t meet our correlation and cointegration filters but that have EXCEPTIONAL looking in-sample backtests over the last two years. We call these WILD CARDS and we think they bear further study of their signals…
How Does The In-Sample Backtest of the New FAST 50 Look?
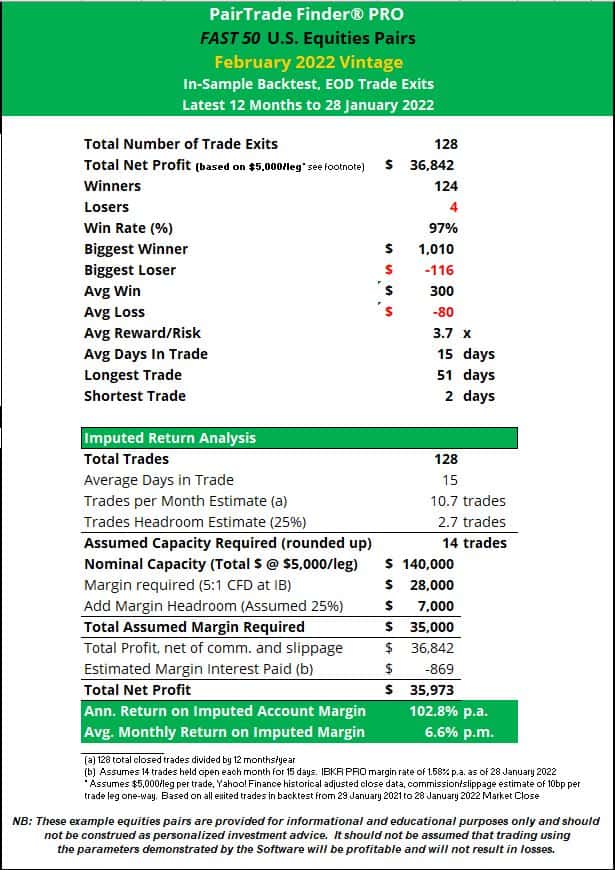
Using Yahoo! Finance End-of-Day Adjusted Close data and a $5,000/leg trading size, which requires about $2,000 of margin to hold each pair trade (5:1 CFD leverage from Interactive Brokers), we summarise below the in-sample backtest of the new FAST 50 for the last twelve months to close of market on Friday, January 28th, 2022. We also show how this backtest would have performed on a return on margin basis using reasonable assumptions for account equity deployed, based on the assumed $5,000/leg position size:
That’s 128 closed trades, 124 winners, 97% win rate, average win of $300/trade, and average days in trade of 15 days.
Let’s see how the February 2022 Vintage FAST 50 perform out-of-sample and with live signals, starting tomorrow!
How Can I Get the New February Vintage FAST 50 U.S. Equity Pairs?
Subscribe today and receive a 15-Day Free Trial of PairTrade Finder® PRO with these FAST 50 U.S. Equities Pairs PRELOADED into your Watchlist. PTF PRO will immediately begin generating live trading signals from these pairs for your further review! These signals and our Trade of the Month video series can help you figure out how to avoid bad pair trades and focus in on the highest-probability pair trade signals.
We also provide you with our eBook with 11 Pro Trading Tips, our 13 Tutorial Videos, and a 4-HOUR, 13-LECTURE PAIR TRADING VIDEO TRAINING COURSE taught by professional pair traders, including how to backtest for the best pairs, filter trading signals for entry, apply sensible position sizing and trade management techniques, and manage a portfolio to give you the best shot at reaching consistent profitability.
Find out all about it at www.pairtradefinder.com
Happy trading.
Geoff, Paul & The PairTrade Finder® Team
NB: The FAST 50 example pair trades in PairTrade Finder® PRO and the trading signals generated therefrom are provided for informational and educational purposes only. They should not be construed as personalised investment advice. It should not be assumed that trading using the parameters demonstrated by the Software will be profitable and will not result in losses. Please see our full Terms & Disclaimer here.


